
 Facebook
 Twitter
 Pinterest
 Copy Link
Blockchain Technology and Cryptocurrencies in Real Estate
This video is the latest in our Monday with Matthew series with Windermere Chief Economist Matthew Gardner. Each month, he analyzes the most up-to-date U.S. housing data to keep you well-informed about what’s going on in the real estate market. A big thank you to Matthew Gardner and the Windermere staff for getting updates like this out so we can stay informed.
Hello there, I’m Windermere Real Estate’s chief economist, Matthew Gardner, and welcome to the latest episode of Mondays with Matthew. This month we’re going to take a look at Blockchain technology and cryptocurrencies themselves and how both may impact home buyers and sellers in the future.
But before we dive into the potential impacts of cryptocurrency on the residential housing market, I must preface this by saying that the very word “crypto” is one that certainly divides people. Some see it as revolutionary, a tangible asset that will take over one day as the de-facto global currency, while others believe it to be unsustainable and ultimately valueless. And there are even some who firmly believe that it’s nothing more than a Ponzi scheme.
Now, everyone is certainly entitled to their opinion, and I will refrain from offering my own view on the currencies themselves, but, although still in its infancy, it continues to evolve and is garnering significant interest from individuals and large corporations alike.
Why are corporations interested, you ask? Well, a recent report from Crypto.com1 put the number of people around the globe who own some form of cryptocurrency at more than 295 million and they are forecasting this number to explode this year and hit the 1 billion mark! And the value of all these currencies today? As of March 14, the combined value of all cryptocurrencies was 1.74 trillion dollars2 with the largest, Bitcoin, valued at almost 740 billion dollars. So, it should not be a surprise to see many mainstream companies across multiple industry sectors start to introduce ways to accept crypto as payment for goods and services.
Companies moving into this space include AMC movie Theaters3 who recently announced their plan to accept coins by the end of this year. Fintech companies like Paypal and Square are also betting on crypto by allowing users to buy currency on their platforms. And, unsurprising to most, Tesla is also interested, but have yet to confirm whether they will accept coins as payment for their vehicles or not.
With cryptocurrencies now gaining traction in mainstream businesses, the housing sector has started to take an interest too with the emergence of companies like Propy, whose goal is to totally automate the home sales process by introducing Blockchain based technology to allow transactions to occur entirely online using smart contracts. Other companies are figuring out how to use blockchain technology to grow the “fractional-ownership” segment of the housing market.
But when it comes to simply buying a house—well that is an entirely different situation. Of course, a home buyer could easily cash out the Crypto they have and use those funds for a down payment, or even to buy a house outright. But we don’t see more of this today as they understand selling their currency is a taxable event and, more than likely, taxes owed will hit their balance sheets pretty hard. And knowing that this is a real issue in the market, it should come as no surprise that a company has come up with a plan to overcome what is seen as one of the biggest obstacles to using digital currency for home buying.
Blockchain Technology and Cryptocurrencies in Real Estate

And they are Milo, who claim to offer the world’s first “crypto-mortgage”. Essentially, they will allow borrowers to use Bitcoin—but only Bitcoin as of right now—as collateral for a 30-year mortgage.
How this works is pretty simple. All buyers have to do is to “pledge” their coins on a one-for-one basis. Simply put, someone looking for a $500,000 mortgage would have to put up $500,000 worth of Bitcoin. This way, they don’t actually have to sell their coins, so there are no tax implications. And instead of going through a FICO credit check and showing proof of income to evaluate a borrower’s creditworthiness, Milo evaluates them based on their crypto wealth as well as the value of the property they are hoping to buy.
And in exchange for locking up their crypto, borrowers get a 30-year mortgage for their home purchase can also make their mortgage payments via traditional currency or Bitcoin. But there are differences between this and a traditional mortgage. First off is the interest rate. It currently ranges anywhere from 5 to 8% depending on the loan-to-value ratio. This is higher than the rate they could get today.
And the interest rate is not fixed, but variable, and based on the prevailing price of Bitcoin. The rate can go up or down depending on the value of the Bitcoin they have pledged, and this mortgage rate will be adjusted every year. Interestingly, if the price of Bitcoin goes up, borrowers can actually take back some of their crypto once a year. If the price of Bitcoin goes down, they may be asked to provide more crypto as collateral.
And finally, when the buyer sells, on closing Milo is paid back in U.S. dollars, and then the seller gets the Bitcoins they used for collateral back, along with the profit made on the sale.
I think that this is certainly an interesting play in the ownership housing sector and, although still in its infancy, looks to meet the needs of crypto owners who don’t want to face the tax obligation that would occur if they were to sell their coins to buy a home. Now, I must make clear that Windermere is certainly not endorsing Milo. In fact, I personally have concerns about the program given how volatile cryptocurrencies are.
You see, it is possible that users may be caught out by the value of their Bitcoin dropping significantly and, if this occurs at or around their anniversary date, it could significantly raise the interest rate—and therefore the monthly payment—on that loan, and if the price drops too far, then they may have to go through what is, in essence, a margin call, where they will have to submit more funds to the lender to bring them back to a point where equity in the home combined with the value of the Bitcoin covers the loan itself.
And I would add that if for some reason the buyer has to sell the home within the first three years4 of purchase there are pre-payment penalties that will be incurred. All in all, it is an interesting model, but it is still in its infancy. As always, time will tell how well it gets adopted.
The bottom line for me is that the likelihood of Cryptocurrency revolutionizing the way we buy homes from a finance perspective is still several years away, but after that, who knows! Something that does have the capacity to be adopted into the mainstream far quicker is the blockchain technology itself. I personally see title insurance as a segment that could benefit significantly and may well adopt this tech sooner than others.
With title insurance companies responsible for verifying and ensuring that a buyer or lender (depending on the type of title insurance) gets either clean ownership or a lien position in the land in question, Blockchain could change many aspects of how these processes are carried out. Here are some of the benefits:
The Potential Benefits of Blockchain Technology in Real Estate
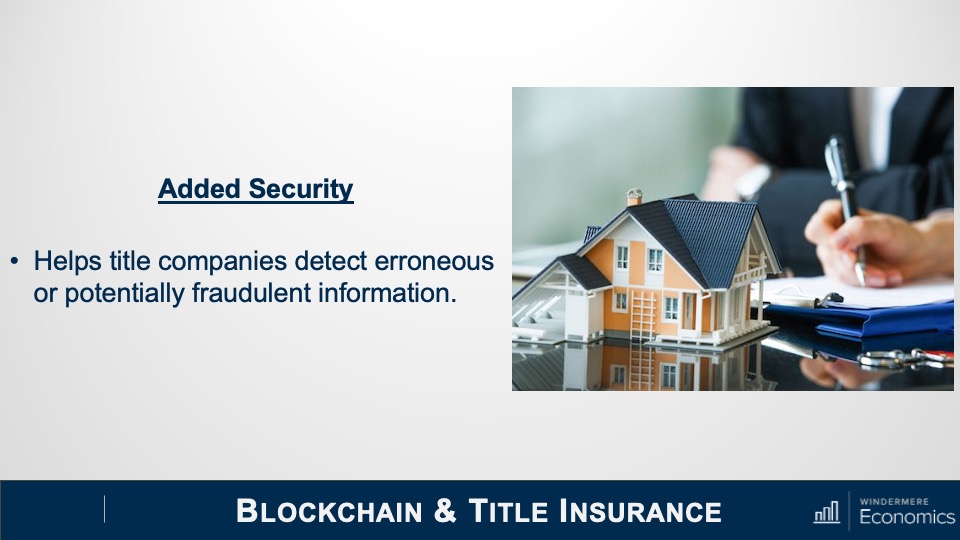
Security. More than 25 percent of title reports (alta.org) detail some form of defect to the title itself, but the ability of blockchain to immediately detect erroneous or potentially fraudulent information can significantly help to support the reliability of the records, therefore making the job of title insurance companies much more straightforward.
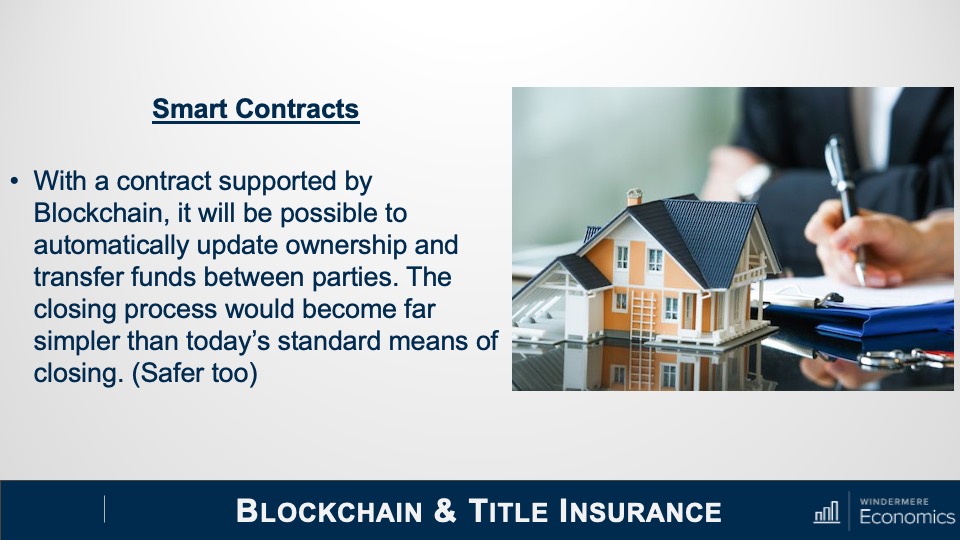
And then there’s smart contracts, which are actually a form of e-closing that is already beginning to be embraced by some in the industry. This technology makes the transfer of ownership almost seamless. Literally, it would take just a few clicks of a mouse. And this is also a massive benefit for the industry as the closing process would also change dramatically and become far more effortless and less time consuming than today’s standard means of closing on a home purchase.
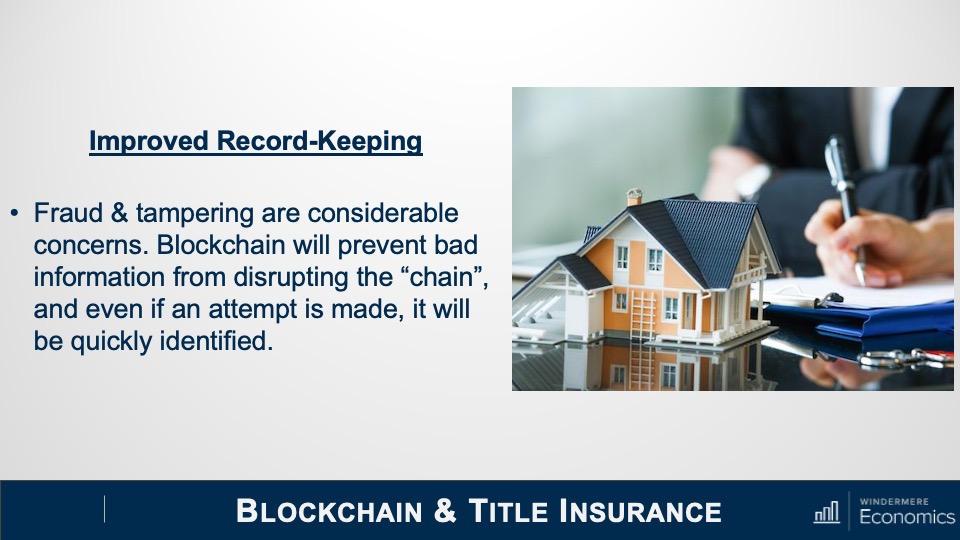
And finally, record-keeping. While fraud and tampering are huge concerns for title companies, blockchain could all but eliminate these instances within ownership records. And, as it would convert land records to a distributed ledger, it cannot be altered within the blockchain itself, therefore making it safe in perpetuity. Blockchain, by design, prevents bad information from disrupting the chain and any attempt to tamper with it can be easily detected and therefore avoided. This is a massive upgrade from the county ledger that title insurance companies find themselves working with today.
No one can deny that Blockchain and cryptocurrencies, while still relatively new, do not appear to be just a flash in the pan. As we have discussed today, a number of companies continue to make inroads into the real estate world. Will some fail? Of course. But others will succeed. So, while still in its infancy, we should all have some sort of understanding of its potential to be a disruptor in the housing space in the future.
It’s my own personal belief that the Blockchain tech itself will be the thing that gets adopted by the real estate world faster than the rise of crypto as a way to buy or finance a home but, whatever your thoughts on this topic are, I think that it is highly unlikely that we will see it simply fade away over time.
As always, if you have any questions or comments about this particular topic, please do reach out to me but, in the meantime, stay safe out there and I look forward to visiting with you all again next month. Bye now.
References:
9/27/2021 Housing and Economic Update from Matthew Gardner
Introducing Matthew Gardner, Windermere’s Chief Economist, and his latest episode of Mondays with Matthew. Read on about what real estate updates he has for us this month.
Today we are going to take a look at the latest Home Purchase Sentiment Index survey that was just put out by Fannie Mae. And for those of you who may not be familiar with this survey, it’s actually pretty important and one that I track closely as it’s the only national, monthly, survey of consumers that’s focused primarily on housing.
The survey shows the responses of 1,000 consumers across the country to roughly 100 survey questions on a wide range of housing-related topics. Now, don’t worry, we aren’t going to look at all 100 questions – just the ones that solicit consumers’ evaluations of housing market conditions and that also address topics related to their home purchase decisions.
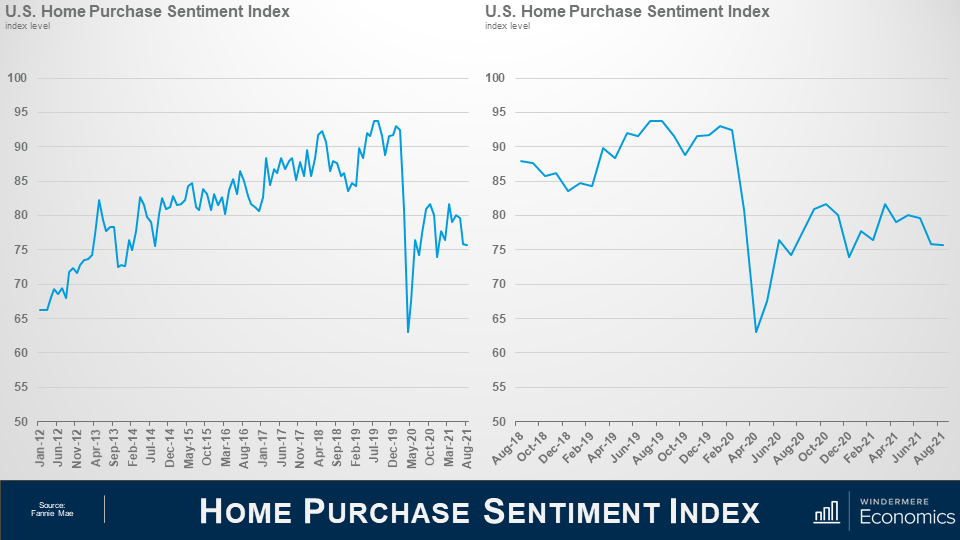
So, as you can see here, the overall index was trending higher pretty consistently until the pandemic happened which had massive, but temporary, impacts. And looking the last 3-years, you can get a better idea as to the speed of the pandemic induced drop – pretty remarkable.
Now, you will also see that the index recovered quite quickly; however, it fell again last fall as the pandemic was not going away at the speed many had hoped for – it rose again this spring but has been pulling back for the past few months but, that said, the August index level essentially matched the level seen in July.
Now let’s look at the questions that are used to create of the index number and how consumers responded.
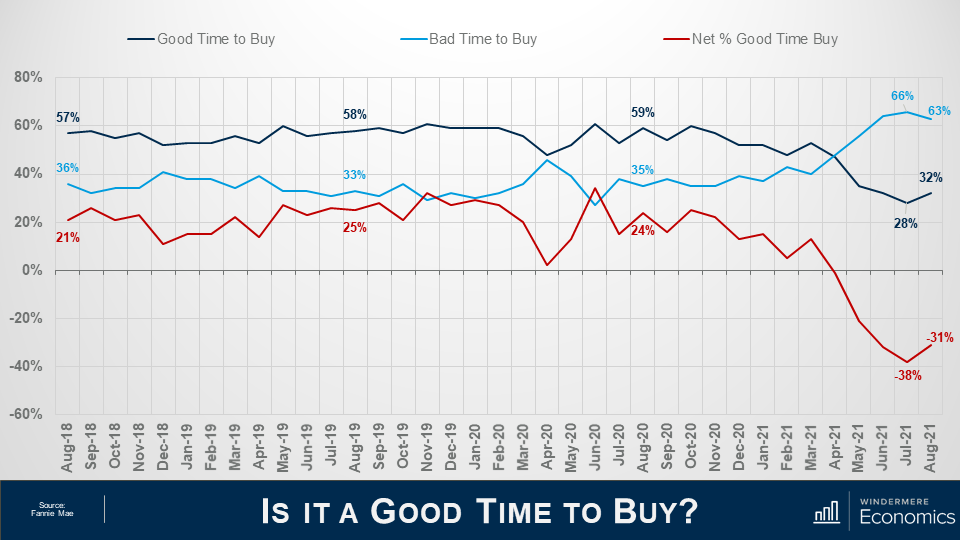
When asked whether it was a good time to buy a home, the percentage who agreed with that statement rose from 28 to 32%, while the share who thought that it is a bad time to buy dropped from 66 to 63%. And, as a result, the net share of those who say it is a good time to buy jumped 7 points month over month and its notable that this is the first time the net share number has improved in the past 4-months.
What I see here is that – although improving modestly, the general consensus is that it is not a good time to buy and that sentiment is being driven by two things: One – there are still not enough homes on the market, and two, rapidly rising prices are scaring some people.
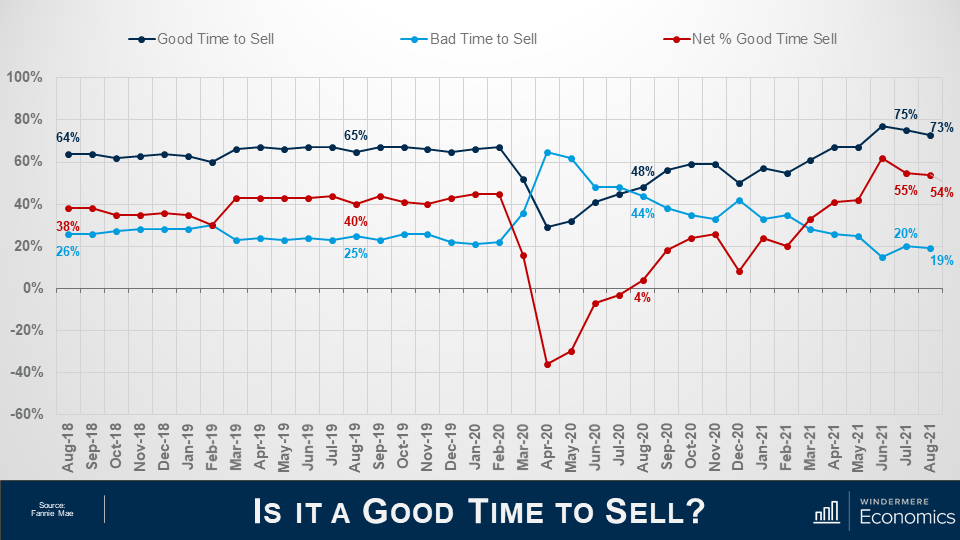
And when asked if they thought it was a good time to sell their homes it was interesting to see that share drop from 75 to 73% while the percentage who said that it’s a bad time to sell dropped 1 point to 19% and as a result, the net share of those who said it was a good time to sell pulled back by 1% but it still indicates that more owners think that it is a good time to sell than don’t.
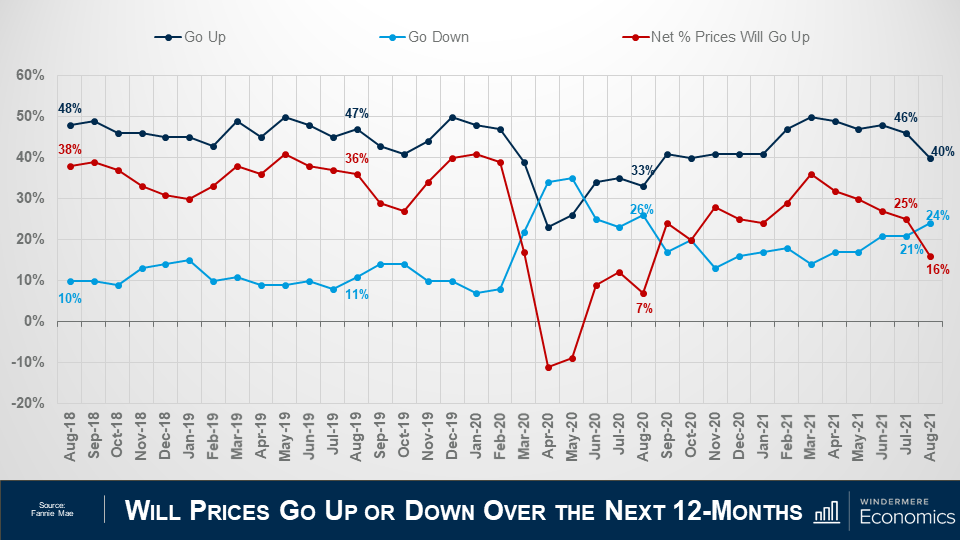
Looking now at the direction of home prices over the next 12-months, the percentage who think that home prices will rise fell from 46 to 40%, while the percentage who expected home prices to drop rose from 21 to 24%.
As a result, the net share of Americans who say home prices will go up dropped by 9 points – from 25%, down to 16%.
Although this may sound concerning, I should add that the share of respondents who thought that home prices will remain static over the next year rose from 27% to 31%.
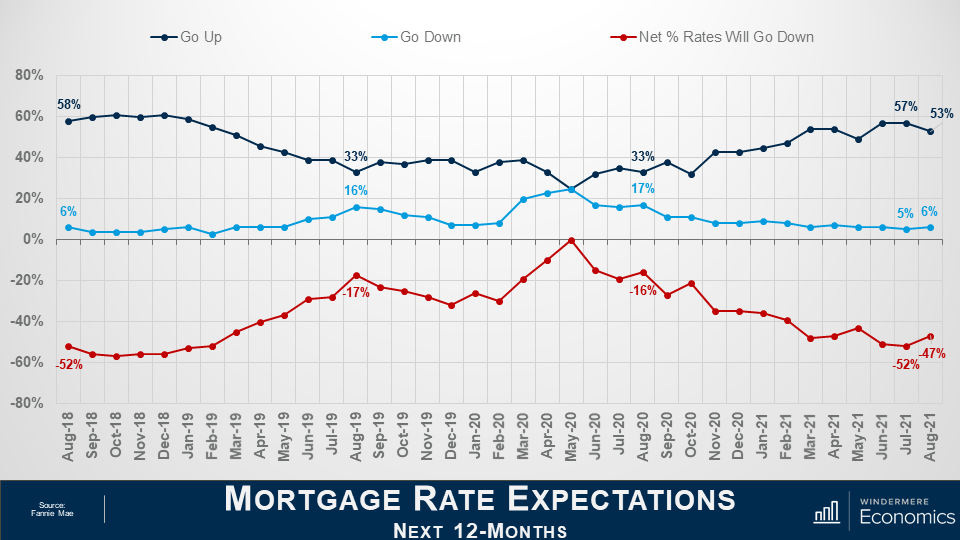
On the financing side, the share who think mortgage rates will rise over the next 12 months dropped from 57 to 53%, while the percentage who believed rates would be lower rose from 5% to 6% and, as a result, the net share of Americans who believed that mortgage rates will go down over the next 12 months rose by 5%, and with 35% of respondents thinking that that rates will hold steady – it’s clear to me that a vast majority are not worried about mortgage rates rising.
The takeaways for me so far are that consumers tempered both their recent pessimism about homebuying conditions and their upward expectations of home price growth.
Most notably, a greater share of consumers believe that it’s a good time to buy a home – though that population remains firmly in the minority at only 32% – while the ongoing plurality of respondents who expect home prices to go up over the next 12 months dropped but was still well above the 24% of consumers who believe home prices will fall.
Now, there are two more questions that are worth looking at which aren’t directly related to home buyers and sellers but are still important as they look at employment and incomes.
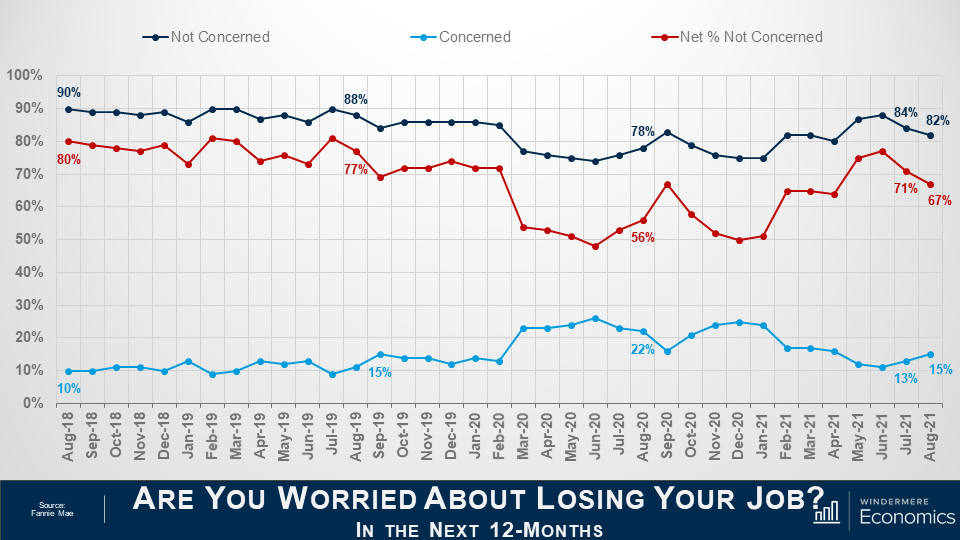
The percentage of respondents who said that they are not concerned about losing their job in the next 12 months remains very high at 82%, but it did drop by 2 points month-over-month, while the percentage who said that they are concerned ticked up to 15% from 13%. As a result, the net share of Americans who say they are not concerned about losing their job fell by 4 percentage points month over month, but remains well above the level seen a year ago.
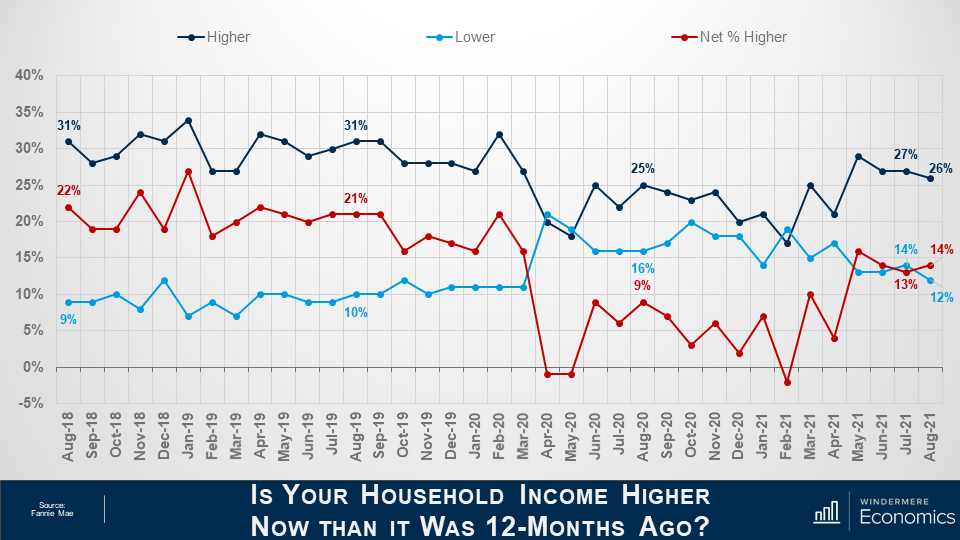
And finally, when households were asked about their own personal finances, the percentage of respondents who said that their household income is significantly higher now than it was 12 months ago pulled back one point to 26%, while the percentage who said that their household income is significantly lower dropped to 12%.
As a result, the net share of those who said that their household income is significantly higher than it was a year ago rose by 1 percent month over month and came in 5 points higher than a year ago. It’s also worthwhile noting that most said that their household income is about the same as it was a year ago with that share rising from 56 all the way up to 59%.
Looking at all the numbers in aggregate, the index level was relatively flat in August with three of the index’s six components rising month over month, while the other three fell, and that tells me that the continued strength of demand for housing and definitely favorable conditions for home sellers may well be offsetting broader concerns about the Delta variant of COVID-19 as well as rising inflation that have both negatively impacted other consumer confidence indices.
Most consumers continued to report that it’s a good time to sell a home – but a bad time to buy – and they most frequently cite high home prices and a lack of supply as their primary rationale.
However, the ‘good time to buy’ component, while still near a survey low, did tick up for the first time since March, perhaps owing in part to the very favorable mortgage rate environment as well as growing expectations that home price appreciation will begin to moderate over the next year. A sentiment that I personally agree with.
Well, I hope that you have found this month’s discussion to be interesting. As always if you have any questions or comments about this topic, please do reach out to me but, in the meantime, stay safe out there and I look forward the visiting with you all again, next month.
Bye now!
